Your Guide to the Best R Packages and Learning Platforms for Data Analysis and Visualization
Stats... oh the horrors
I recently stumbled upon a gold mine of extremely useful R packages that i know i needed to share with all of you. I hope that you will be able to benefit from this issue and gain something valuable!
easystats
easystats is a collection of R packages designed to streamline and enhance the statistical analysis process. Each package serves a distinct purpose, allowing you to choose the tools that best fit your needs. As you become more familiar with these packages, you'll find they work seamlessly together, creating an efficient and cohesive workflow.
Here are some of the packages listed on their page:
report: 📜 🎉 Automated statistical reporting of objects
correlation: 🔗 The all-in-one package to run correlations
modelbased: 📈 Estimate effects, group averages and contrasts between groups based on statistical models
effectsize: 🐉 Compute, convert, interpret and work with indices of effect size and standardized parameters
see: 🎨 The plotting companion to create beautiful results visualizations
parameters: 📊 Obtain a table containing all information about the parameters of your models
performance: 💪 Models’ quality and performance metrics (R2, ICC, LOO, AIC, BF, …)
datawizard: 🧙 Magic potions to clean and transform your data
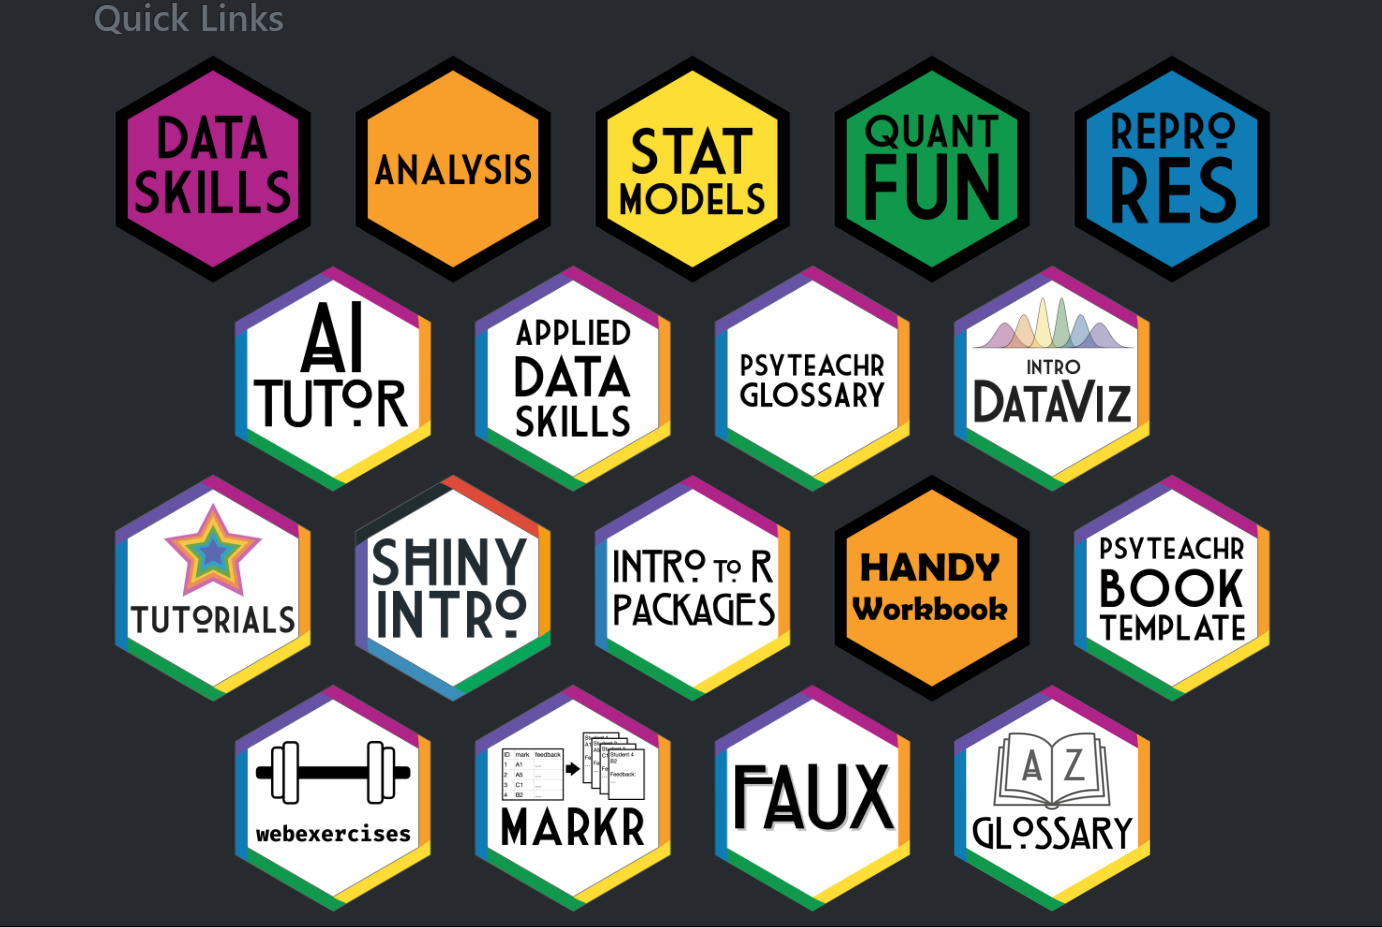
psyTeachR
The psyTeachR team at the University of Glasgow’s School of Psychology and Neuroscience has revolutionized how reproducible research is taught, integrating R into their curriculum at all levels. Their extensive library of free materials is a treasure trove for students eager to enhance their data science skills.
Here’s what you can learn from psyTeachR’s open course modules and materials:
How to bring in and simulate data for your analysis.
Master the art of wrangling data into the perfect format for analysis.
Calculate and summarize data
Produce informative and visually appealing graphics.
Perform basic probability calculations and simulations.
Many chapters include walkthrough videos, code snippets, and solutions to activities, making it an invaluable resource for both beginners and advanced learners.
Tidyverse
The Tidyverse is an opinionated collection of R packages that simplify data science by providing a consistent design philosophy and data structure across its components. Whether you’re manipulating data or creating visualizations, Tidyverse packages offer powerful tools to make your work more efficient.
Key packages in the Tidyverse include:
ggplot2: Create declarative graphics based on The Grammar of Graphics, with data-driven aesthetics and effortless detail management.
dplyr: Manipulate data with a set of verbs that address the most common challenges.
tidyr: Organize your data into a tidy format where each variable has its own column, and every column represents a variable.
readr: Efficiently read and parse various data types, ensuring your data is ready for analysis.
purrr: Enhance your functional programming toolkit, simplifying complex operations.
tibble: A modern take on data frames, encouraging cleaner, more expressive code.
stringr: Work with strings easily, thanks to a cohesive set of functions.
forcats: Simplify handling categorical variables with tools that address common problems with factors.
If you found this guide helpful, don’t forget to subscribe to our newsletter for more tips, resources, and updates. We hope you're finding time to relax and recharge as summer comes to a close—stay tuned for more exciting content to help you stay ahead in your studies!

Until next time,
Take care!


